In past years, the level of Hungary’s economic development rose dynamically, and the lag behind the more advanced Western European economies has been gradually declining. At the sixth station of the MNB’s 5+1 series of articles on convergence, we present the degree of Hungary’s convergence relative to the Benelux states. The Benelux states belong to the more advanced economies in the European Union. Owing to their size and geographic position, they are – similarly to Hungary – extremely open, and thus they serve as a good benchmark in terms of Hungary’s convergence. The Benelux states are also strongly related to the German economy, and thus Germany’s dynamic growth over recent years provided substantial support also for growth in the Benelux states. Nevertheless, the difference between the economic development of Hungary and the Benelux economies has materially declined.
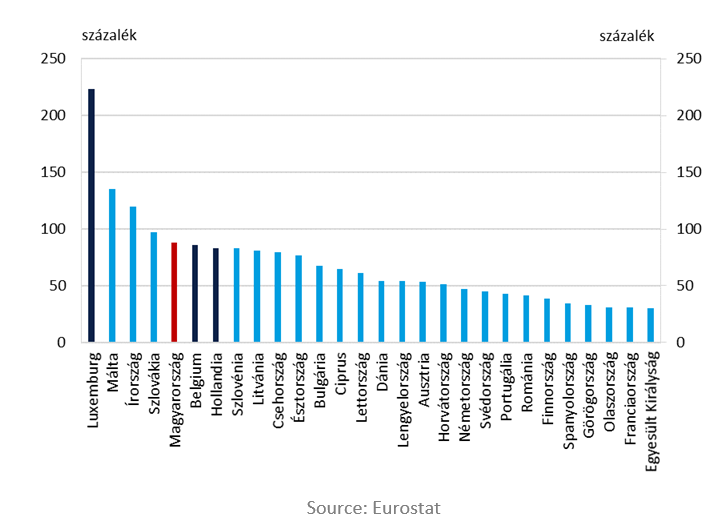
The Benelux states belong to the most advanced economies of Europe, and owing to their size and geographic position, they are extremely open, similarly to Hungary, and their export-to-GDP ratio is one of the highest (Chart 1). The integration of the Benelux states, and particularly that of Belgium and the Netherlands, in the European and global economy, is greatly supported by the closeness of three large European economies, i.e. the United Kingdom, France and Germany, and their sea ports.
The companies in the region also have an important role in the production chains built by German companies. As regards their conditions, the Benelux states compare with Hungary in several respects. In terms of their population, all of them belong to the smallest countries of Europe. Although Hungary has no sea port, growth in Asia’s importance in global economy may appreciate Hungary’s role in international continental trade. A further similarity is that many Hungarian companies participate in the German production chains. Due to the foregoing, for the purpose of assessing the convergence of the Hungarian economy it may be relevant to compare the macroeconomic and competitive position of Hungary and the Benelux states. Below we show the changes in Hungary’s relative position in a variety of areas on 5+1 charts.
Chart 1: Export volume as a percent of GDP (2017)
In past years, exports of Hungarian companies have risen extremely dynamically.
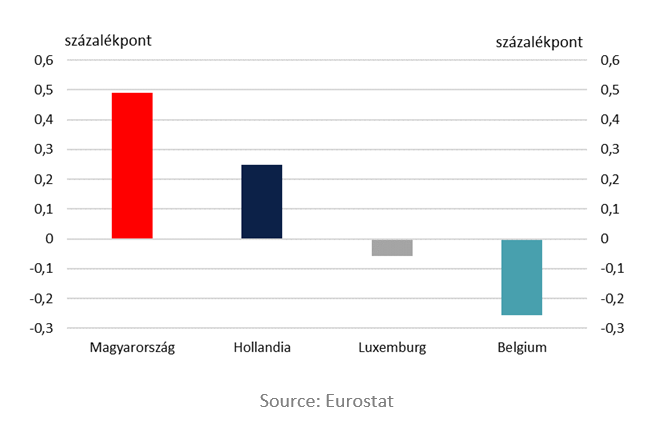
In view of the fact that the Benelux and the Central and Eastern European states are equally important in the production chains built by the German companies, these economies are susceptible to changes in global economic activity. Owing to buoyant global economic activity, between 2010 and 2017, German economic output rose rapidly, which also provided major support for growth of the economies involved in the German production chains. At the same time, the individual countries were able to capitalise on rising German imports to a different degree.
Hungary was able to benefit from the upturn, and its share in German imports – similarly to that of other Central and Eastern European countries – rose markedly. Between 2010 and 2017, the weight of the Hungarian economy rose by 0.5 percentage point, while among the Benelux states, the share of the Netherlands increased to a smaller degree than that, and the share of Belgium and Luxembourg declined (Chart 2).
Chart 2: Changes in the share in German imports between 2010 and 2017
In past years, the Hungarian economy has recorded brisk growth and its lag behind the Benelux states has gradually declined. In assessing Hungary’s growth, it should be emphasised that the government has regarded the maintenance of the macroeconomic balance as a priority throughout the growth period. In recent years, the current account balance continuously has registered a surplus, the budget deficit has remained low and the debt ratios have gradually improved.
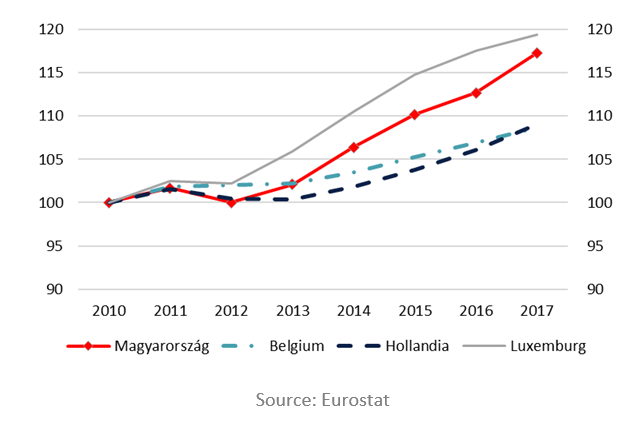
The Hungarian growth rate, in addition to maintaining balance, materially exceeded growth in the Belgian and Dutch economies, and it was similar to economic growth in Luxembourg (Chart 3). From 2013 onwards, monetary policy made major contribution to the favourable growth trends of Hungary, partly through maintaining the low interest environment and financial stability, and partly through launching targeted, innovative programmes to support growth. The income per capita indicators – calculated at purchasing power parity, which also takes into consideration the change in the price levels – show that between 2010 and 2017 the difference between the economic development of the Benelux states and Hungary declined materially, by roughly 8 percentage points.
Chart 3: Changes in real GDP (2010 = 100)
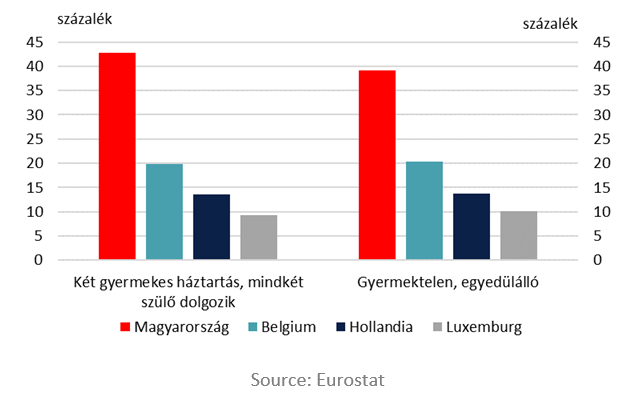
The positive impact of economic growth in Hungary can be perceived in a wide range of households, in view of the fact that the rise in output was accompanied by an increase in real wages. The increase in net wages was also supported by the reduction in labour taxes. As a result of the government’s family supporting measures, the rise in earnings was particularly high in the case of the employees with children. Between 2009 and 2015, in the case of families with two children and two wage-earners, the rise in the purchasing power of net wages exceeded 40 percent in Hungary, being more than twice as high as the rise in Belgian wages, which recorded the highest growth index among the Benelux states (Chart 4).
Chart 4: Changes in the net average wage between 2009 and 2015 (based on PPS)
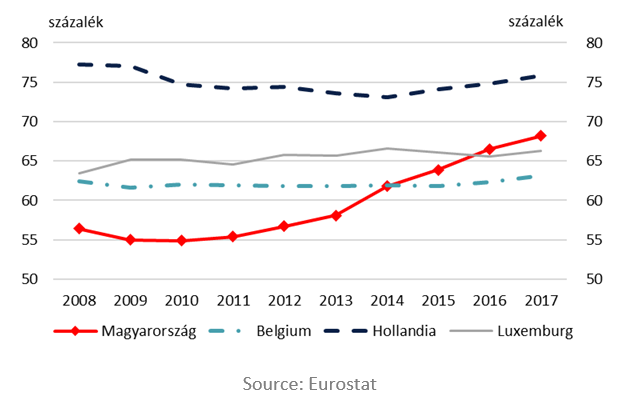
One of the key achievements of post-2010 economic policy was the rise in employment. Low employment curbed the performance of the Hungarian economy already before the onset of the crisis. The employment rate was low by European standards, and it also substantially fell short of the values observed in the Benelux states (Chart 5). Until 2010, labour taxes were characterised by a high tax burden and progressivity, which encouraged concealment of income and made the creation of jobs with high value added more expensive.
From 2010, the reform of the tax regime and the introduction of the flat rate personal income tax were key elements among the measures aimed to boost employment. The reform of the social system – which, in the past, was unsuitable for the stimulation of labour force participation – (e.g. tightening the control of disability pension, restricting retirement before the pensionable age and early retirement pension, shortening the duration of the unemployment benefit), also increased the supply of labour. Between 2010 and 2017, the number of people in employment rose from 3.7 million to 4.4 million, and thus Hungary’s lag behind the Benelux states disappeared in respect of the labour market indices.
Chart 5: Changes in the employment rate (15-64 years)
Favourable Hungarian labour market trends are also reflected in the unemployment data. From 2013 onwards, the number of unemployed persons declined sharply in Hungary, and at present the unemployment rate is even lower than the values characterising the Benelux states (Chart 6). It is a positive development that Hungary also managed to reduce the unemployment of groups of low labour market activity materially. While in the Benelux states, apart from the Netherlands, the unemployment rate of juvenile workers fluctuates around 20 percent since 2010, Hungary managed to push down this indicator from around 25 percent, recorded at the beginning of the decade, gradually close to 10 percent.
Chart 6: Changes in the unemployment rate (15-64 years)

The comparison of the development path of the Hungarian economy and the economies of the Benelux states is a good illustration of the results achieved by the economic policy pursued after 2010. In addition to achieving and maintaining macro-financial balance, the development of the Hungarian economy approximated the developed European economies. However, the difference is still large. The improvement in the quality of human resources, the raising of the productivity of domestic enterprises and the strengthening of internal financing can be achieved only gradually, which requires longer time. However, the achievements to date serve as a good basis for continued convergence in the coming years.
