How much money do Hungarians working abroad send home in a year?
EnglishIn 2019, Hungarian employees working abroad sent home more than 158 billion forints. The highest amount, about 65 billion, was transferred from Germany to Hungary. Due to the double-digit wage growth in the three years before the coronavirus, our migration surplus and the number of returnees have been accelerating since 2017. As a result of the Covid pandemic, 16,000 of our compatriots working abroad lost their jobs.
Since 1995, Hungarians living and working abroad have been sending more and more money home – növekedés.hu learned from the Central Statistical Office (KSH). The trend has accelerated since the 2008 global financial crisis.
While in 2008 HUF 10.3 billion was sent home by Hungarian people working in other countries, by 2019 this amount had grown to HUF 158.3 billion.
Money sent home by employees working abroad, HUF billion
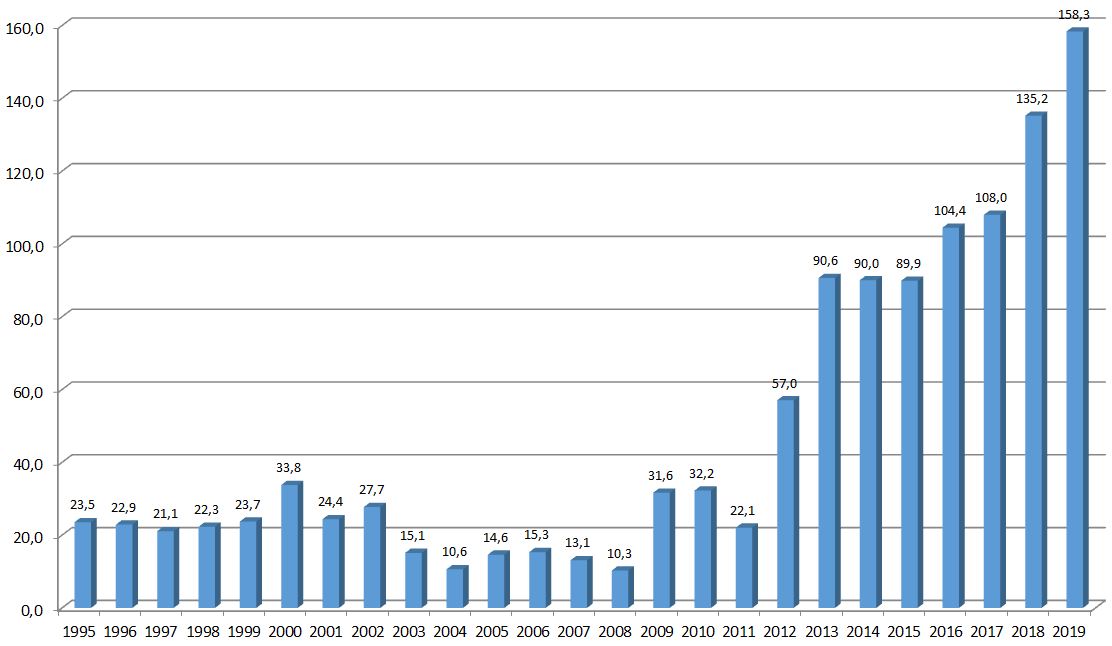
Source: KSH, növekedés.hu
As for individual countries, Hungarians sent home the most money from Germany: in 2019, the amount came close to HUF 65 billion.
Austria was second, while the UK finished third. The higher remittances arriving from Germany can be explained, among other things, by the greater weight of higher value-added work.
Foreign remittances to Hungary by country, 2019, HUF billion
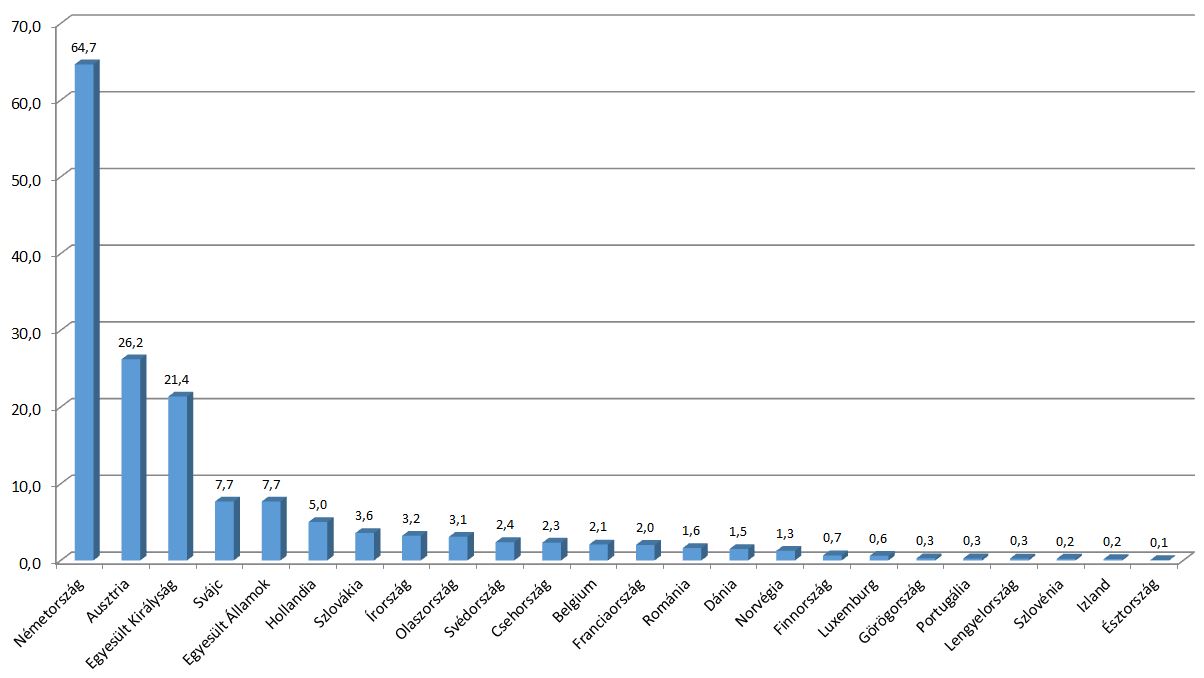
Source: KSH, növekedés.hu
Number of Hungarians working abroad
The number of Hungarians working abroad is the highest in Austria, with more than 50,000 workers last year. More than 26,000 Hungarians had jobs in Germany and 5,000 in the United Kingdom. In 2020, a total of nearly 100,000 Hungarian citizens were working abroad.
This is 16,000 less than in 2019, which is mainly due to the coronavirus epidemic and its negative impact on the economy and health.
Number of Hungarians working abroad by destination country
|
|
Austria |
Germany |
United Kingdom |
Other countries |
Total |
|
2004 |
7 830 |
4 684 |
978 |
6 997 |
20 489 |
|
2005 |
7 864 |
5 235 |
1 437 |
6 955 |
21 492 |
|
2006 |
10 123 |
6 013 |
1 875 |
6 688 |
24 698 |
|
2007 |
11 054 |
5 800 |
2 132 |
6 316 |
25 302 |
|
2008 |
11 513 |
7 553 |
3 978 |
10 283 |
33 327 |
|
2009 |
14 135 |
10 021 |
5 934 |
10 247 |
40 336 |
|
2010 |
17 463 |
11 347 |
7 662 |
13 062 |
49 534 |
|
2011 |
22 889 |
13 682 |
8 200 |
16 602 |
61 373 |
|
2012 |
29 820 |
23 771 |
8 931 |
17 867 |
80 389 |
|
2013 |
44 759 |
28 630 |
8 293 |
15 778 |
97 459 |
|
2014 |
44 102 |
29 723 |
6 503 |
19 412 |
99 741 |
|
2015 |
52 684 |
31 328 |
9 309 |
17 787 |
111 108 |
|
2016 |
51 545 |
33 882 |
10 769 |
20 190 |
116 387 |
|
2017 |
49 300 |
32 924 |
10 721 |
16 661 |
109 606 |
|
2018 |
50 155 |
32 268 |
5 431 |
16 826 |
104 681 |
|
2019 |
56 543 |
33 272 |
6 220 |
20 058 |
116 094 |
|
2020 |
50 612 |
26 411 |
4 800 |
18 061 |
99 884 |
Source: KSH, növekedés.hu
Gender differences
Men are apparently more open to working abroad. The number of male employees working abroad was nearly three times as high in 2020 and 2019 as that of female employees.
Number of Hungarian men and women working abroad
|
Men |
Women |
Total |
|
|
2017 |
83 240 |
26 365 |
109 606 |
|
2018 |
77 343 |
27 338 |
104 681 |
|
2019 |
86 157 |
29 936 |
116 094 |
|
2020 |
75 092 |
24 792 |
99 884 |
Source: KSH, növekedés.hu
International migration
In 2016, net emigration stopped after a long time, while from 2017 our immigration surplus was growing at a faster rate. More and more people returned to Hungary, which is due, among other things, to the extensive and rapid growth of the economy and dynamic wage growth.
During 2017, 2018 and 2019, average wages grew at a rate of more than 10 percent per year in Hungary. This was accompanied by an average inflation rate of around 3 percent, which
resulted in an extremely fast real wage increase. The rising standard of living in Hungary has convinced more and more Hungarians abroad to return to Hungary.
International migration of Hungarian citizens
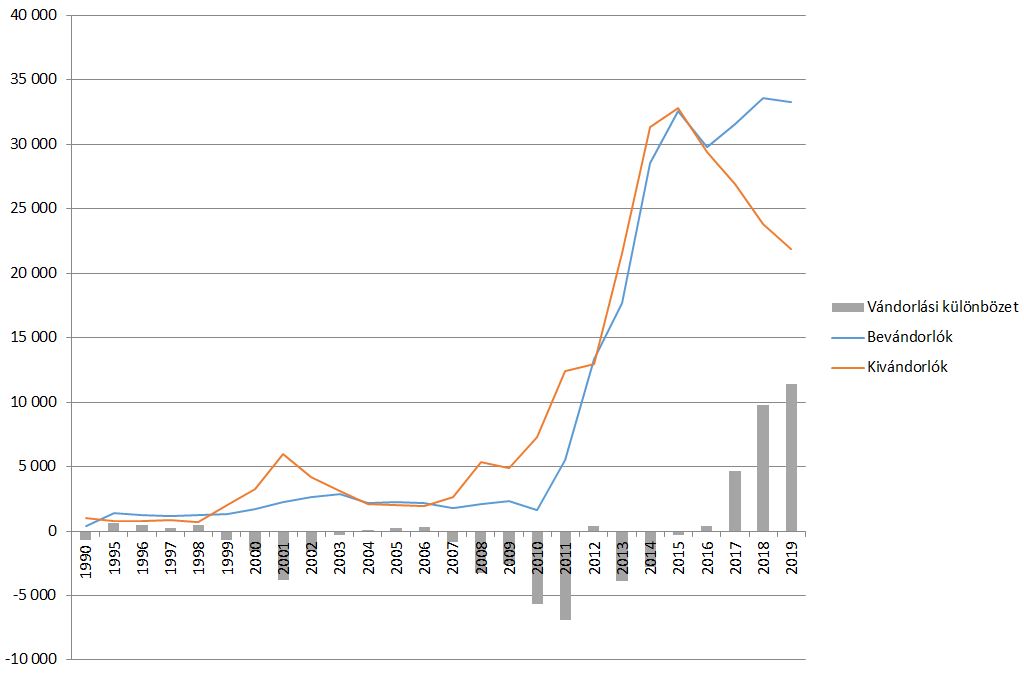
Source: KSH, növekedés.hu
How many people commute to work abroad?
Data on employees commuting to work abroad are available from the census conducted by KSH in 2011.
In that year, there were more than 27,000 Hungarian employees who commuted to work abroad while retaining their residence in Hungary.
There can be many reasons for commuting, but most common of all is the difference in wages. The majority of commuters took up work in Austria. Apart from that, commuting to Slovakia and Romania can be considered significant, although the motives are different in the case of those countries.
Most of those commuting abroad were under the age of 44, with secondary education, mainly vocational qualifications. Commuting was most common in the hospitality and catering sectors, and in the industry.
Number of Hungarian commuters by age, 2011
|
Age group |
Total |
|||
|
Austria |
Romania |
Slovakia |
||
|
15–29 |
5 227 |
4 481 |
240 |
425 |
|
30–34 |
5 261 |
4 426 |
246 |
480 |
|
35–39 |
5 216 |
4 389 |
290 |
407 |
|
40–44 |
4 119 |
3 445 |
276 |
306 |
|
45–49 |
2 720 |
2 186 |
147 |
290 |
|
50–54 |
2 338 |
1 841 |
162 |
233 |
|
55–59 |
1 793 |
1 428 |
121 |
165 |
|
60–69 |
427 |
281 |
37 |
70 |
|
70– |
27 |
11 |
4 |
9 |
|
Total |
27 128 |
22 488 |
1 523 |
2 385 |
Number of commuters by highest level of education, 2011
|
Highest level of education |
Total |
|||
|
Austria |
Romania |
Slovakia |
||
|
Primary school (< 8 grades) |
64 |
45 |
9 |
6 |
|
Primary school (8 grades) |
1 880 |
1 566 |
100 |
165 |
|
Secondary school without maturity, with vocational certificate |
11 962 |
10 888 |
338 |
587 |
|
Secondary school with maturity |
9 241 |
7 665 |
520 |
827 |
|
University or college degree |
3 981 |
2 324 |
556 |
800 |
|
Total |
27 128 |
22 488 |
1 523 |
2 385 |
Number of commuters by economic activity, 2011
|
Economic activity |
Total |
|||
|
Austria |
Romania |
Slovakia |
||
|
Agriculture, forestry, fishing |
1 917 |
1 772 |
52 |
55 |
|
Industry |
4 706 |
3 906 |
308 |
360 |
|
Construction |
3 898 |
3 501 |
144 |
202 |
|
Commerce, vehicle repair |
2 366 |
1 696 |
260 |
337 |
|
Transportation, storage |
2 264 |
1 779 |
164 |
249 |
|
Hospitality and catering |
4 841 |
4 625 |
64 |
122 |
|
Information, communication |
344 |
156 |
33 |
127 |
|
Finance, insurance |
252 |
129 |
29 |
80 |
|
Real estate |
81 |
45 |
13 |
20 |
|
Science, engineering |
545 |
301 |
78 |
109 |
|
Office administration |
660 |
550 |
30 |
67 |
|
Public administration, defence, compulsory social insurance |
284 |
110 |
42 |
82 |
|
Education |
453 |
209 |
76 |
122 |
|
Healthcare, social services |
1 012 |
825 |
55 |
104 |
|
Arts, entertainment, leisure |
325 |
226 |
42 |
41 |
|
Other services |
667 |
512 |
55 |
76 |
|
Household work, production and service for own use |
842 |
767 |
34 |
33 |
|
Other |
1 671 |
1 379 |
44 |
199 |
|
Total |
27 128 |
22 488 |
1 523 |
2 385 |
