Among the leaders regarding external balance indicators - the past decade of the Hungary’s economy in numbers
EnglishThe latest article in the Magyar Nemzeti Bank’s series analysing the state of the economy and the transformation of the domestic growth model describes the significant improvement achieved in the external position of the country. The dynamic domestic growth since 2013 was achieved in parallel with a permanent surplus in the current account.
Due to the favourable external balance position of the Hungarian economy, the external vulnerability of the country has been significantly reduced, while the debt indicators of the country have improved, and this played an important role in the upgrading by S&P lately. In the past decade, Hungary did not only correct its disadvantage compared to the region, but also became one of the best in several indicators. All this is a significant improvement from the aspect of the country’s external assessment and a possible new crisis, and it is reflected in the assessments of the credit rating agencies, the IMF and the European Commission, too, indicating the resistance of the economy.
Over the past few years, we witnessed a rare phenomenon in Hungarian economic history: the economy grew, and it was accompanied by a surplus in the current account.
The financing model of growth was significantly transformed after 2013. In earlier the growth was primarily financed from foreign funds, therefore economic growth coupled with an increase in external debt indicators (e.g. external debts), i.e. with the increased external vulnerability of the country. However, it was impossible to maintain a growth financed from debt over the long term: the improvement in the external balance position went hand in hand with economic decline. In the presently ongoing growth period, however, we can observe a permanent surplus in the current account and a significant adjustment of external debt indicators: it means that the present period of catching up is based on mostly internal and domestic resources. In the following paragraphs, we will briefly review the factors that facilitated all this, and how these processes developed in the Visegrád Countries.
Chart 1: Business cycles of the Hungarian economy and changes in current account balance between 1949 and 2018
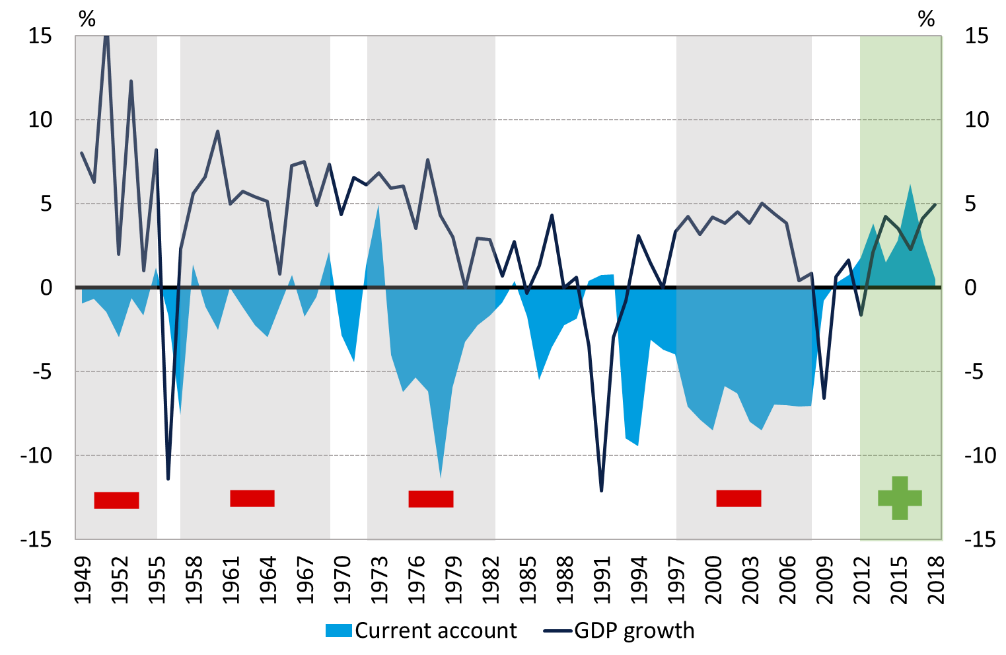
Note: the coloured stripes indicate the longer periods of boom, while the signs in the figure show the current account balance in the respective period.
Source: HCSO, MNB estimate
Over the past decade, the net lending of the Hungarian economy was continuously higher than that of other countries in the region.
Net lending is a key indicator of the vulnerability of individual countries, and provides information on the reliance of the economy on external sources. Net borrowing (in other words, the balance of payments’ deficit) typically indicates that the level of domestic savings is low compared to investments, and the country needs to involve external funds. On the other hand, with net lending (i.e. when the current account shows a surplus), domestic agents can reduce their external debt accumulated earlier, or even finance foreign capital investments. Following the crisis, the whole region was characterized by an improvement in the external balance position, but Hungary achieved the most growth.
The development of indicators showing external vulnerability in the past few years played an effective role in the upgrading that started in the spring of 2015, with the latest upgrade by Standard & Poor's taking place in the middle of February 2019.
In the last ten years, net lending was below 4 per cent everywhere in the region, while in Hungary it was gradually increasing, and reached a historic peak of around 7 per cent of the GDP in 2015. In line with a strong increase in domestic demand in the region, Hungary’s net lending dropped in the last three years, but it is still outstanding.
Chart 2: Net lending in the ratio of the GDP, in regional comparison
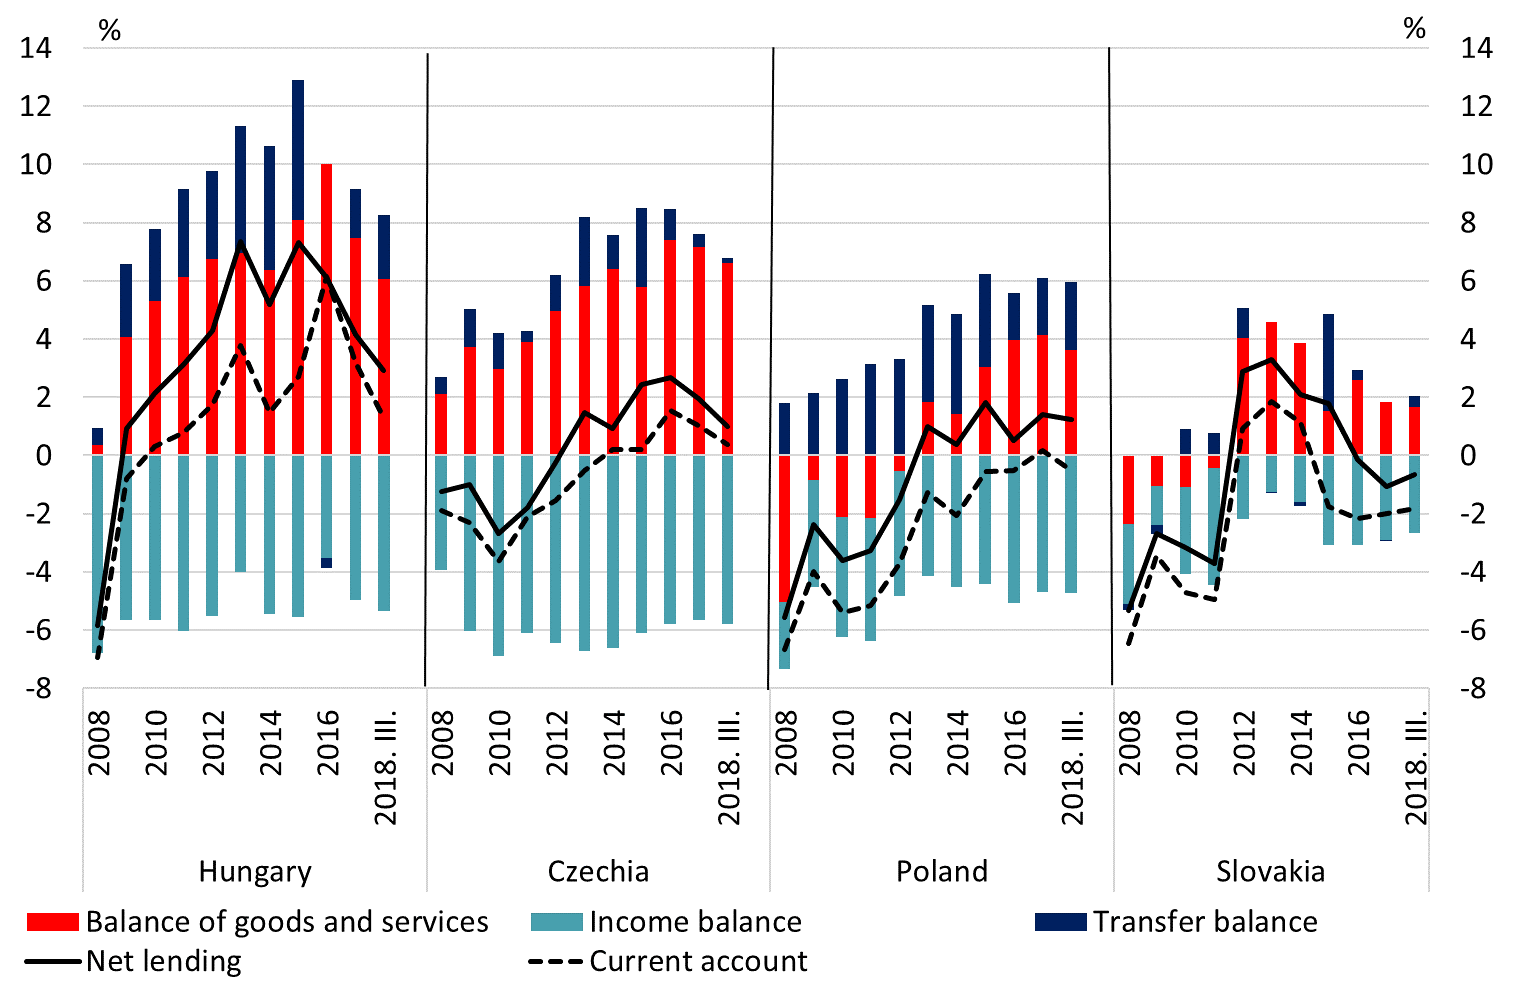
Source: Eurostat
The high surplus in the balance of trade and the changes in its structure allowed the Hungarian balance of payments to remain above the region’s average permanently.
Initially, following the crisis, declining internal demand resulted in less imports, which, in turn, increased the balance of goods, and this contributed to a surplus in the Hungarian current account balance, but later an increasing trend was observed in the service balance.
The emergence of services in an increasingly wider scope, became a general phenomenon at international level, and among the countries of the region, Hungary saw the most significant increase in their role in foreign trade. In spite of the decrease in the past two years, Hungary’s economy continues to have the highest current account surplus in the region, driven by a service balance stabilised at high levels - which is less dependent on the economic cycles.
Chart 3: Balance of trade in the ratio of GDP and current account balance
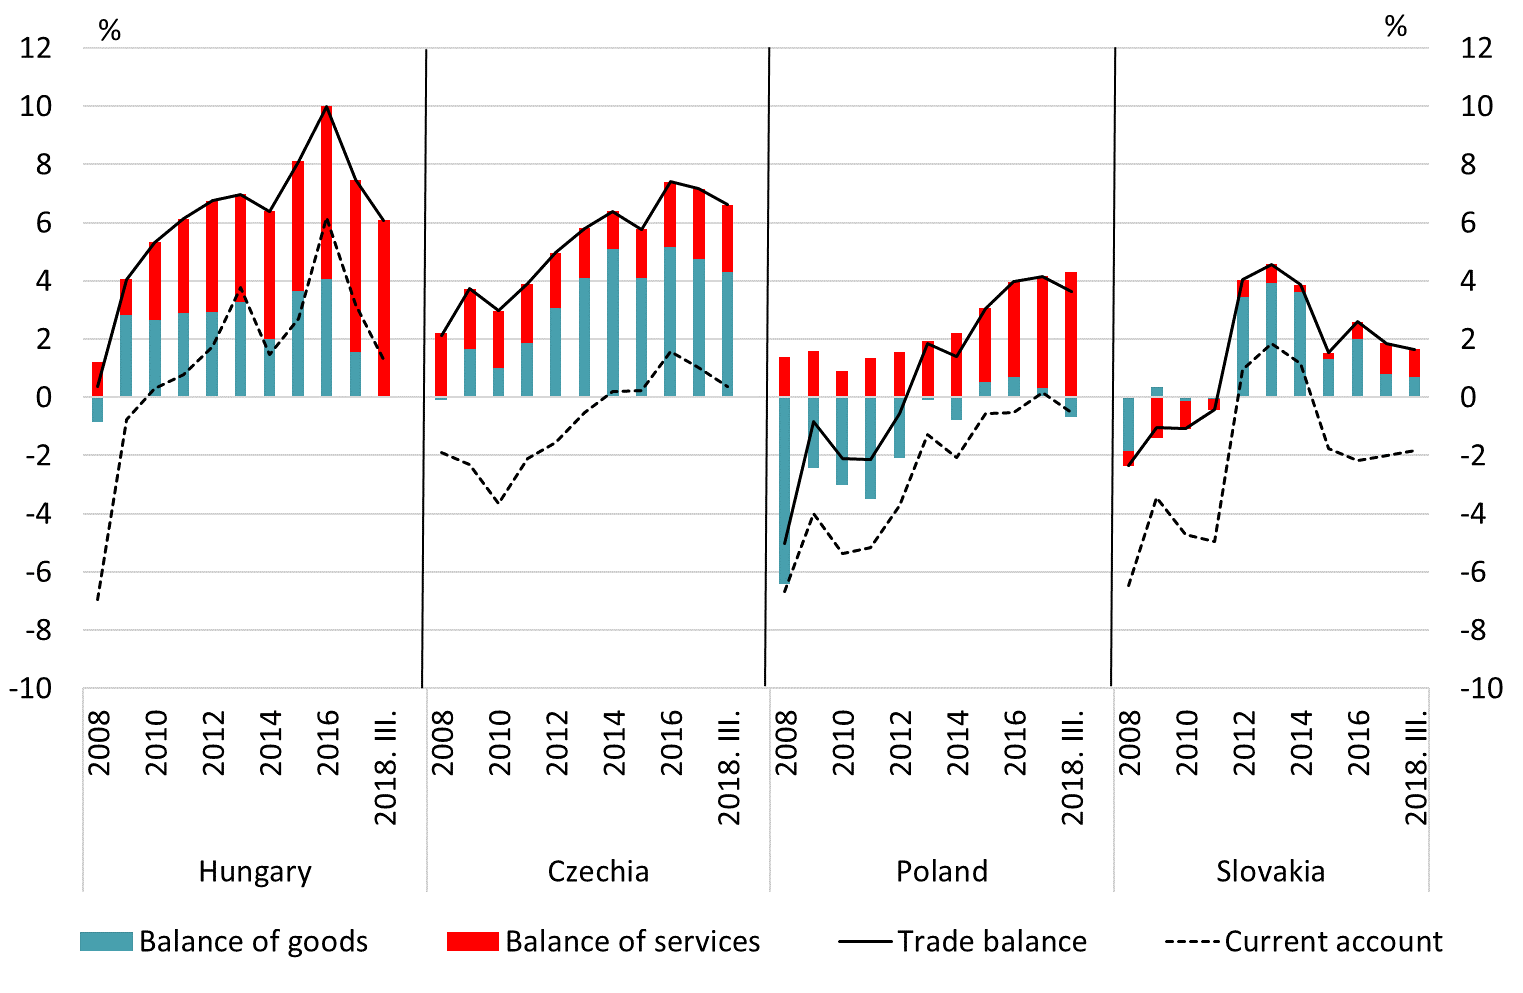
Source: Eurostat
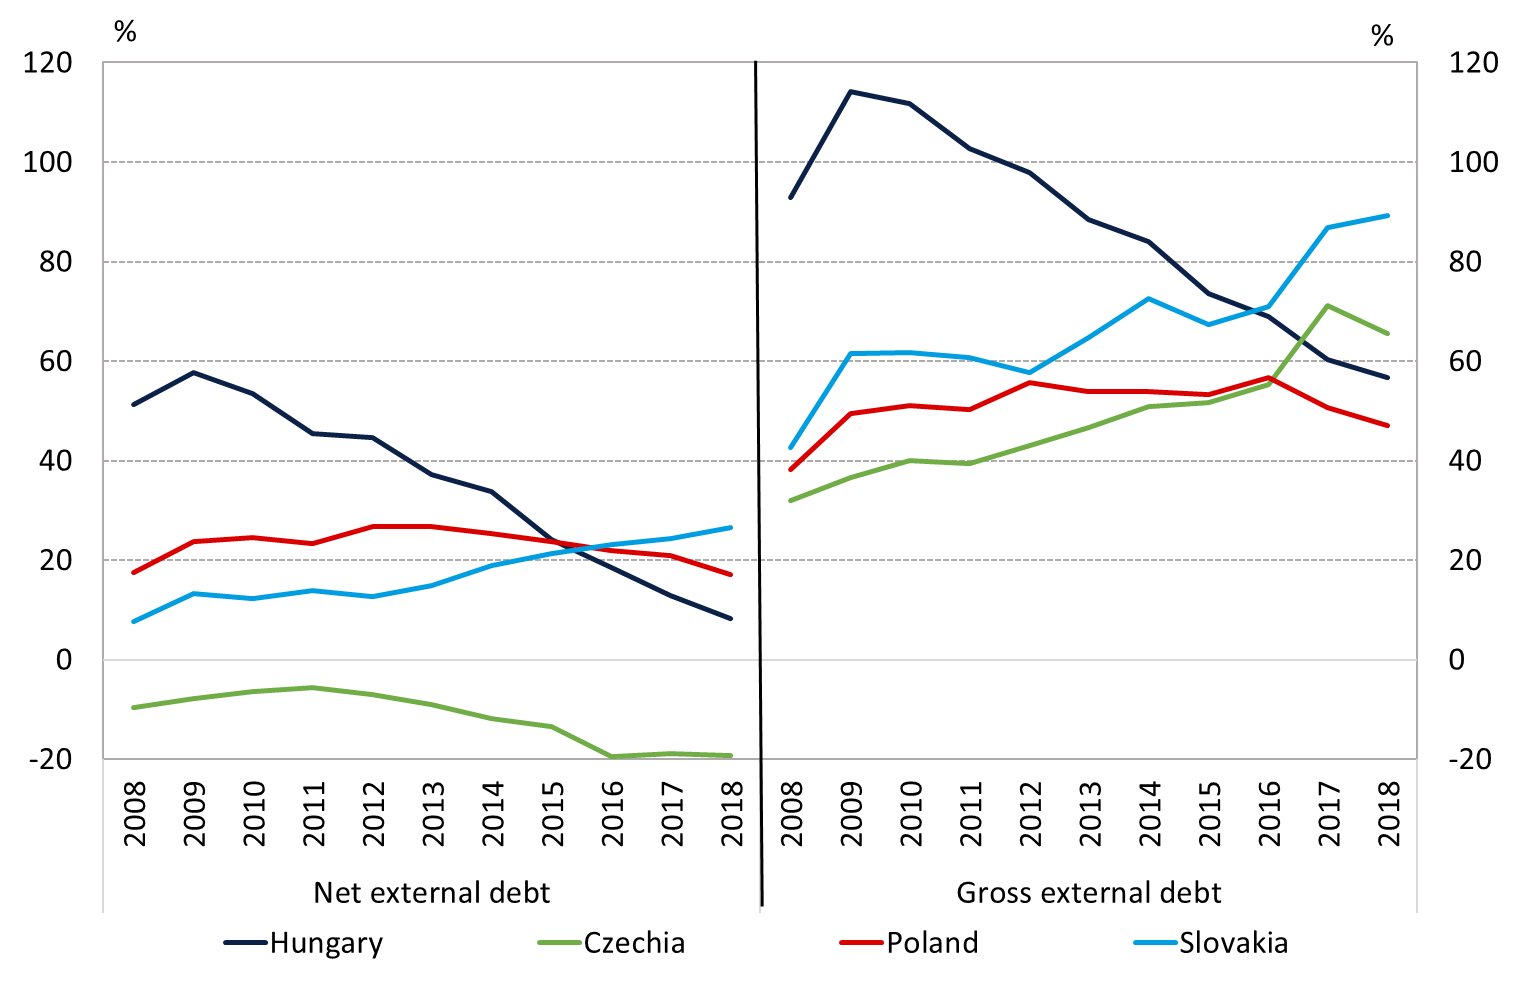
As a result of the high net lending, Hungary's gross and net external debt declined by more than 35 per cent of the GDP in the past 10 years, while these indicators typically increased or declined only slightly in other countries of the region (Chart 3).
The gross external debt of a country shows the amount of foreign debts accumulated by the economic players. From the aspect of vulnerability, this indicator is important, as, for instance, the events in 2008 did not only prove that external funds might quickly leave the country in the case of an external shock, but they also showed that the indicator deteriorated the picture held by foreign investors and credit rating agencies on economic processes.
In other words, excessive gross external debt means a renewal risk, too, which may lead to tension on the money market - and to higher yields and decline in exchange rates through increased risk surcharges.
While gross external debt shows only the external indebtedness of the economic players in a country, net external debt takes into account not only the debt, but also how much of debt type assets (foreign currency reserves) invested abroad economic players have. After 2008, the significant net lending that emerged in Hungary was reflected in the decrease of the external debts of the country. Between 2008 and 2018 Hungary’s gross external debt fell by more than 35 per cent of the GDP overall, while net external debt dropped by more than 40 per cent of the GDP. This is the highest extent of decrease among the countries of the region, in which external debt indicators actually grew during the period - with the exception of Romania.
Chart 4: Changes in gross and net external debt in the ratio of the GDP, between the end of 2008 and Q3 of 2018
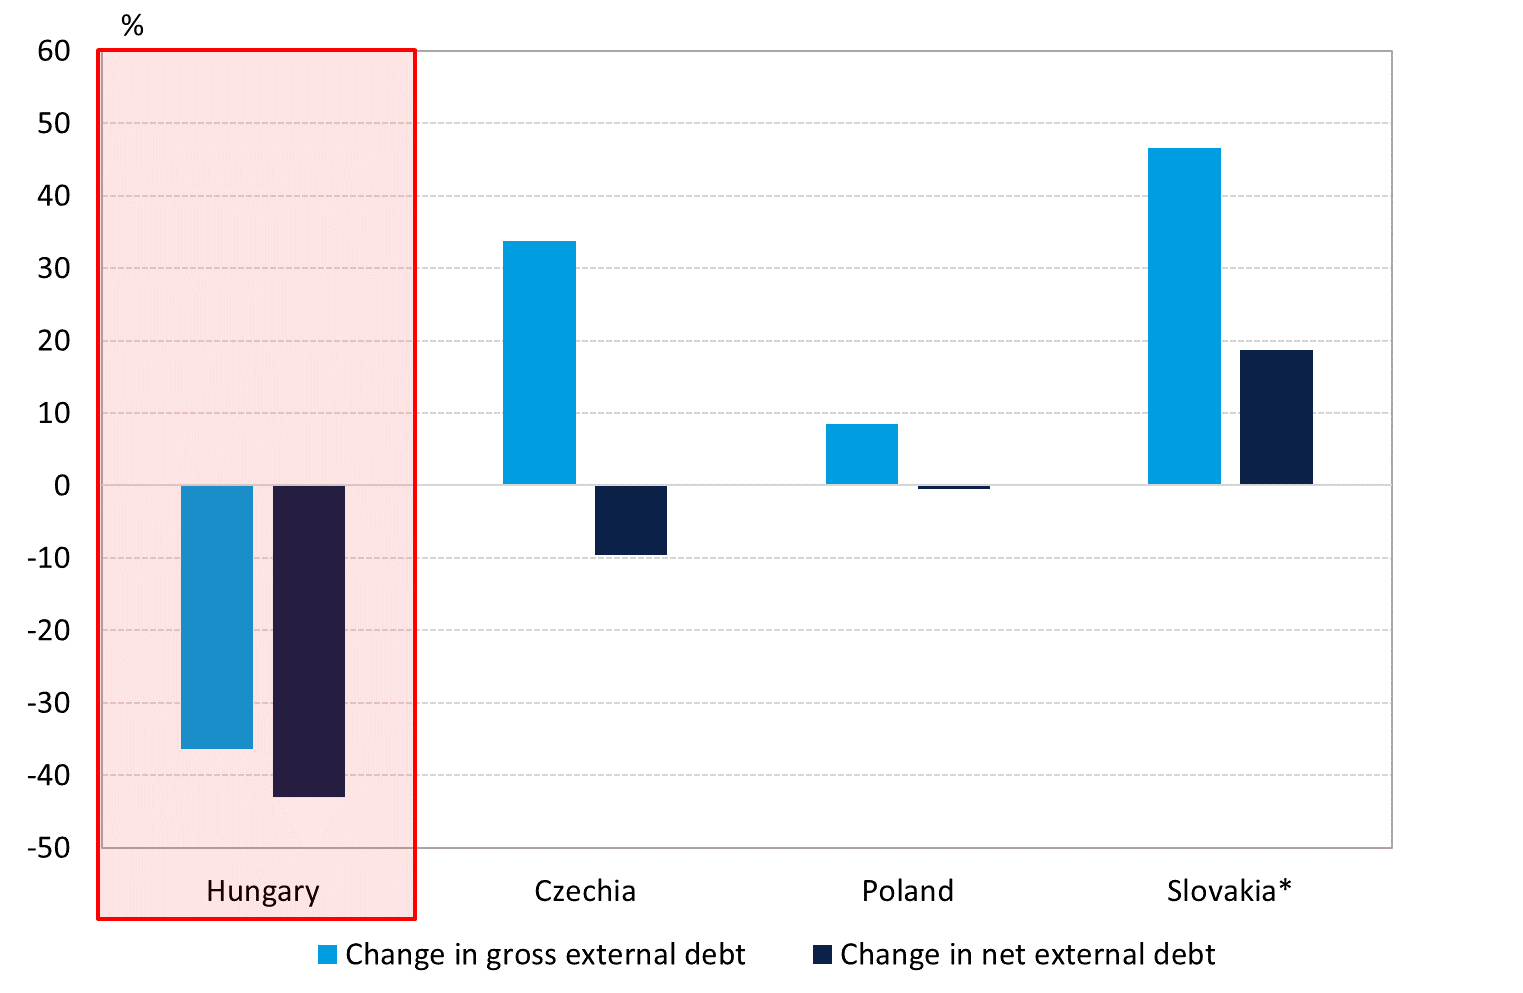
* The rise in Slovakia’s gross external debt also reflected its rising liabilities in relation to the payment system of the euro area. Note: Excluding owners' loans.
Source: Eurostat
Due to the outflow of debt, we were able to catch up with the region as regards debt indicators: Hungary’s gross and net external debt corresponds to that observed in the countries of the region.
By the end of Q3 of 2018, Hungary's gross external debt fell below 60 per cent of the GDP, and the net external debt fell below 10 per cent of the GDP, which corresponds to the average values in the countries of the region.
While Hungary’s gross external debt was extremely high compared to its peers when the crisis hit, as a result of the downward trend of the past few years it is now in the middle of the regional ranking. This process was supported by the fact that households were engaged in repaying their loans instead of borrowing, the general government deficit decreased and the government’s foreign debt was reduced continuously partly due to households’ government bond purchases and the Magyar Nemzeti Bank’s Self-Financing Programme.
As a result of the post-crisis adjustment, in parallel with the gross external debt, the net indicator also decreased considerably. Due to the significant decline in recent years, the level of Hungary’s net external debt is low. In the region, the indicator is lower only in the Czech Republic and in Romania. The reduction was first supported primarily by the decrease in external debts, and lately by the growth of the foreign assets of the private sector.
Chart 5: Gross and net external debt portfolio in the ratio of GDP in the region
Note: Indicators without owners' loans until Q3 of 2018.
Sources: Eurostat
Overall, in recent years, in terms of external vulnerability indicators, Hungary did not only adjust for its lag behind the region, disclosed during the crisis, but caught up with the average of the region in several indicators, and even became one of the leaders.
The financial crisis in 2008 and the debt crisis in the Mediterranean countries highlighted the importance of external debt and balance indicators. This is supported, for instance, by the fact that the European Commission monitors several indicators originating from the balance of payment statistics, in its mechanism supervising macroeconomic imbalances (MIP).
In addition, several analyses produced on the external vulnerability of a country by market, investment bank or international institutions paid special attention to these indicators. Therefore it is particularly important that from the disadvantages felt at the time of the crisis, Hungary caught up with the region, owing to the fact that it was in Hungary where the dynamics of external balance processes was the most favourable.
However, the improvement in the balance of payments did not require any sacrifice in growth: in the past six years, the fall in external debt – in a way not seen before – coupled with growth. In addition, the permanently favourable external balance processes made it possible to reach the regional average in certain indicators, and to be among the best: the firmly high balance of services and the improvement in debt indicators contributed to the fact that the Hungarian economy is now much more resistant to external shocks, including a possible crisis.
